The Science of Multi-Year Breakouts: Decoding ADANIENT via Fibonacci Geometry
Overview: Why Most Investors Miss 10x Returns
In the quest for long-term wealth, curiosity is your greatest asset. While retail traders hunt for daily percentages, institutional wealth is built on the "Silent Accumulation" phase. By studying the 15-year lifecycle of Adani Enterprises (ADANIENT), we can learn how to identify assets before they undergo a massive valuation shift.
The charts shared here represent real market data across multiple timeframes. Before any trade execution, cross-referencing these timeframes is essential to validate the setup and avoid false breakouts.
Chart 1: Monthly Timeframe (15-Year View)
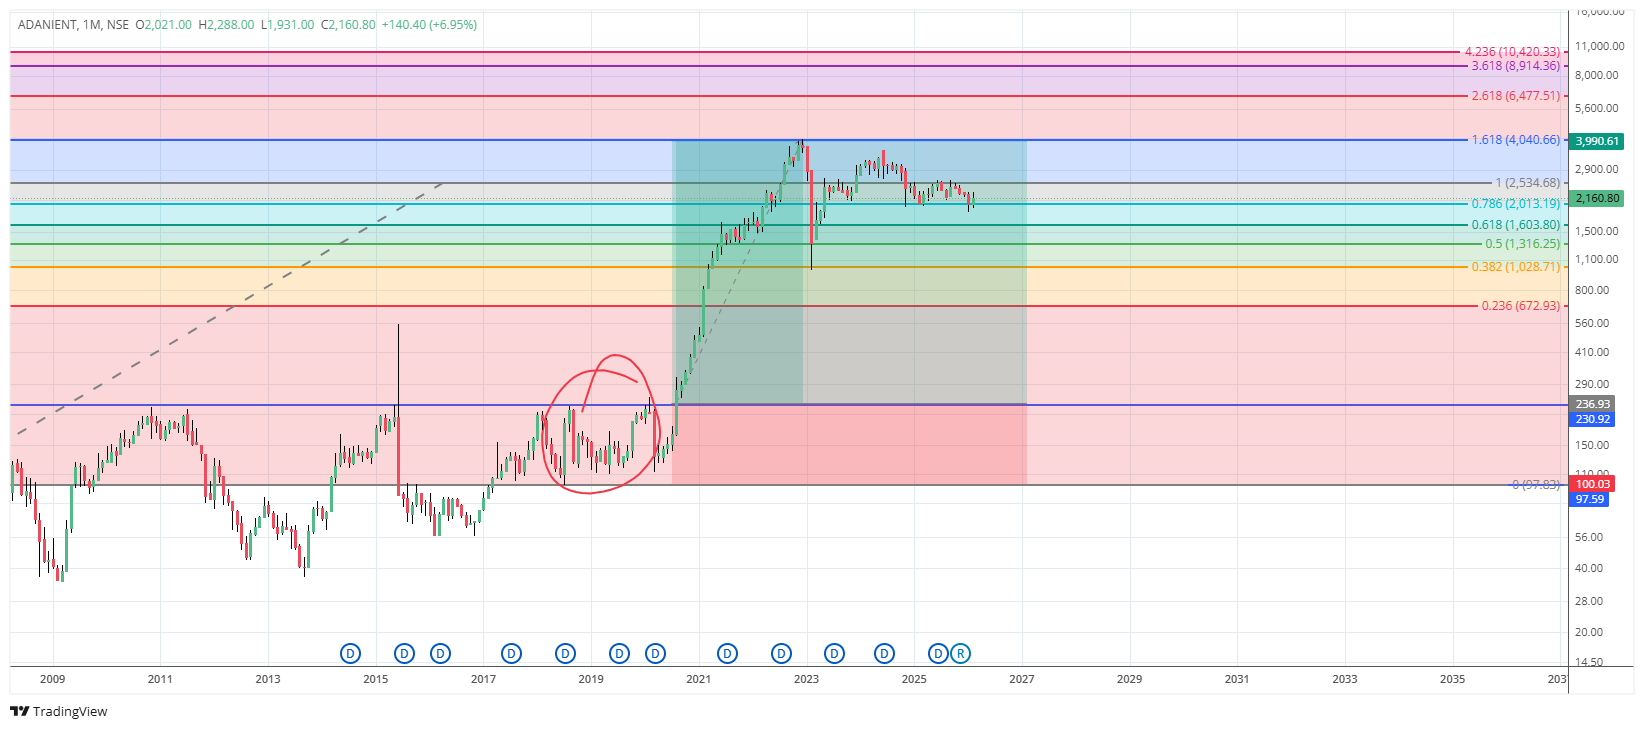
📈 Current Price (Feb 22, 2026): ADANIENT is trading at ₹2,160.80, up +6.95% on this session. The monthly chart shows a clear breakout from the ₹1,600-2,000 range established over the past 3 years.
The Foundation: 5 Years of "Silent" Accumulation
Between 2015 and 2020, the market largely ignored ADANIENT. It stayed boxed between ₹100 and ₹230. This horizontal range (visible in your 2017–2019 charts) represents what institutional traders call "hand-changing" - the slow transfer of shares from weak hands to strong hands.
The Technical Box: Why did it refuse to drop below ₹100? Because the floor was being reinforced by long-term positioning. Every dip below ₹120 was quickly absorbed, creating a demand zone that would later become the launchpad for the multi-year rally.
Chart 2: Monthly Timeframe (Detailed Fibonacci Levels)
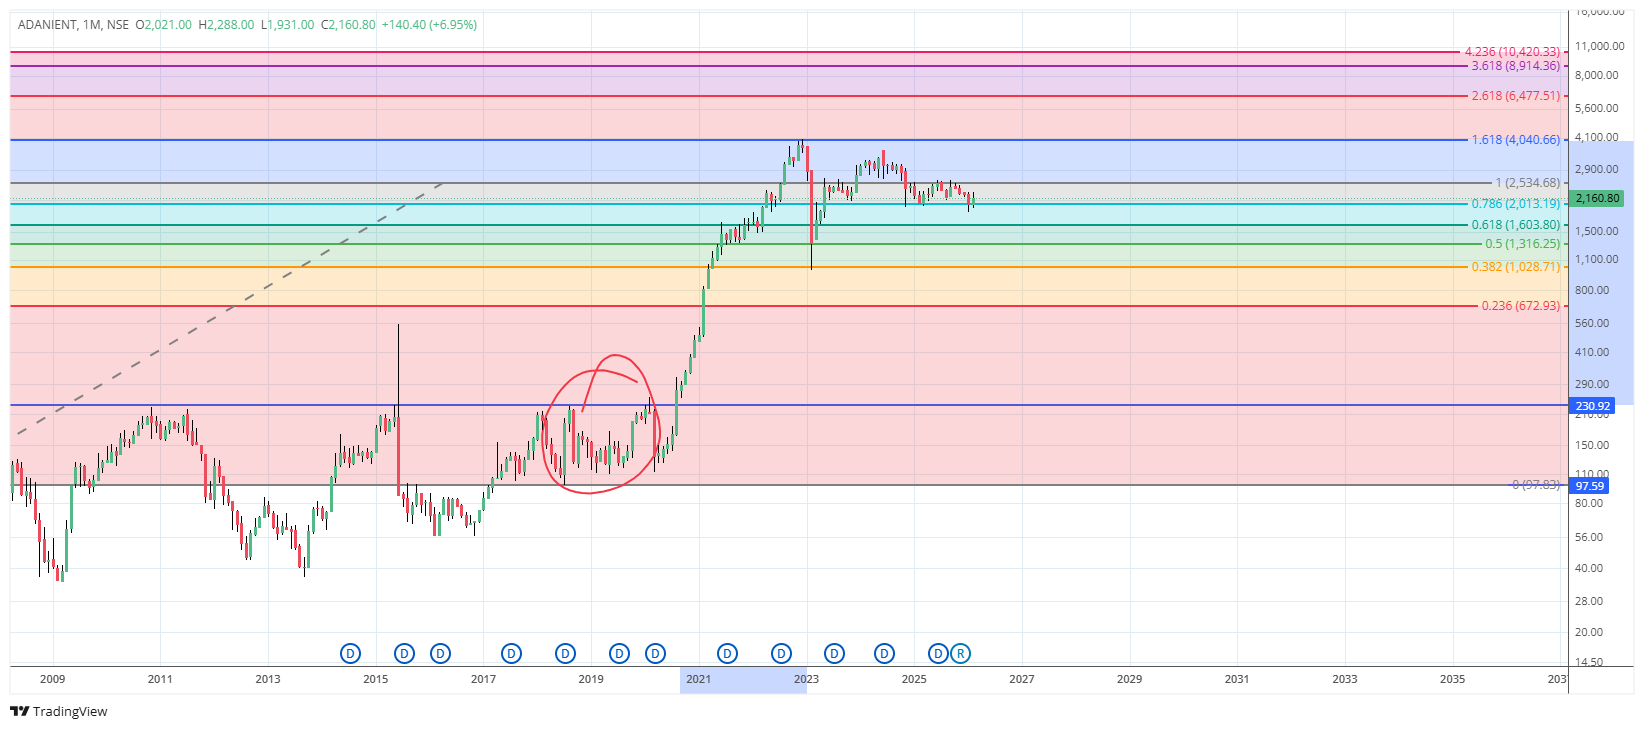
The Fibonacci Map: Predicting the Unpredictable
Using the Fibonacci Extension tool from the 2009 low (₹100) to the 2020 high (₹2,500) and back to the 2020 low (₹1,000), we can map out future targets long before the price reaches them. For ADANIENT, the 2020 breakout wasn't random—it followed a mathematical path:
| Fibonacci Level | Price Target (₹) | Educational Context |
|---|---|---|
| 0.618 (Golden Pocket) | 1,603 | The "Confidence" Zone - where institutions add positions |
| 0.786 | 2,013 | Deep retracement - last buying opportunity before breakout |
| 1.0 (Full Retracement) | 2,534 | The "Fair Value" Peak - previous all-time high |
| 1.618 (The Extension) | 4,040 | The Institutional Target - primary profit-taking zone |
| 2.618 | 6,477 | Extended target - requires strong fundamental backing |
| 3.618 | 8,914 | Bullish extension - seen in historic bull markets |
| 4.236 | 10,420 | Theoretical maximum - extreme bull case |
Chart 3: Daily Timeframe (Entry Precision)
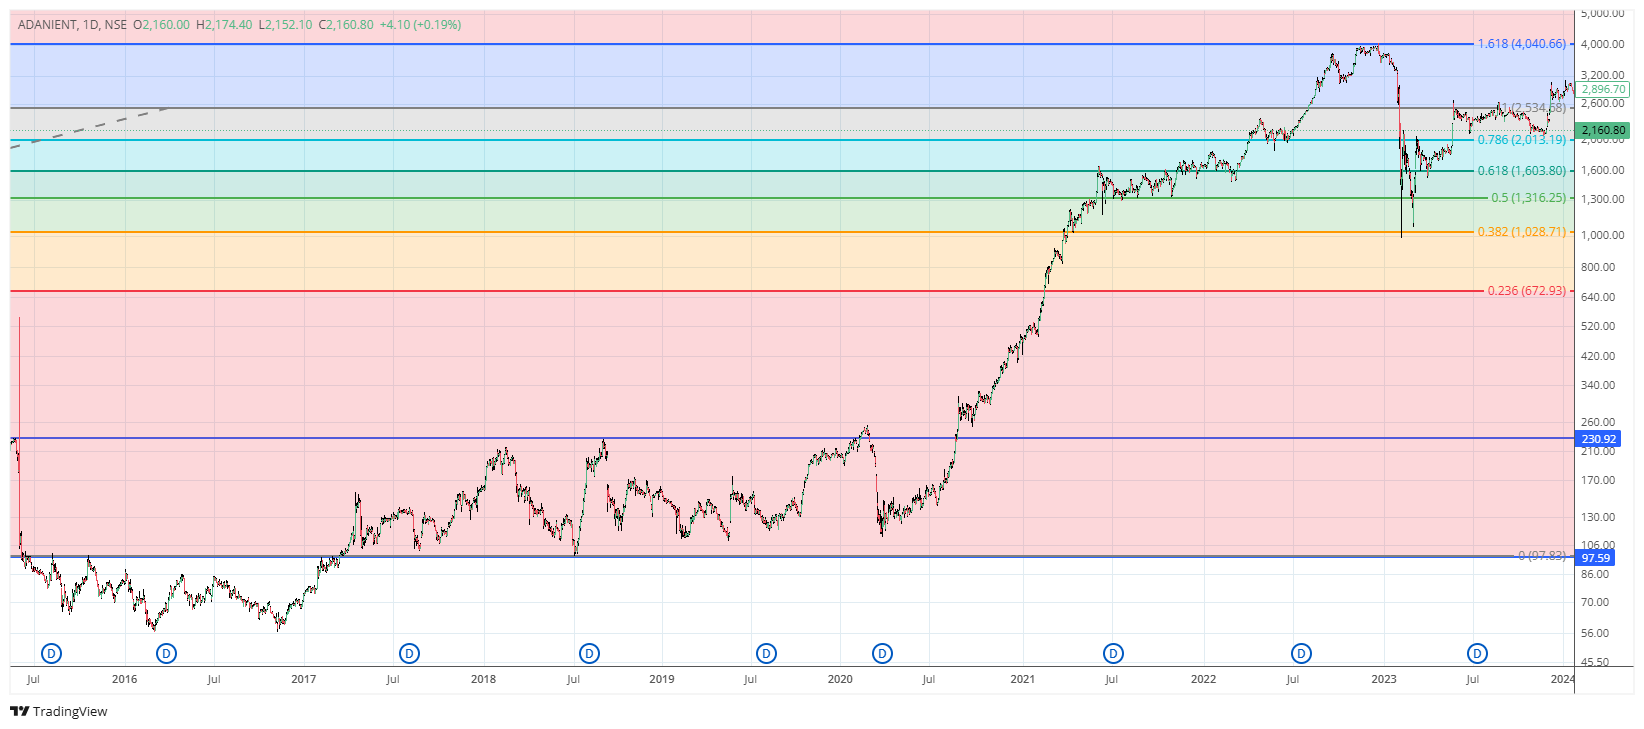
The Breakout Confirmation
Look closely at the 2019–2020 zone in the monthly charts. The "Huge Difference" started when the price successfully flipped the ₹230 resistance into a permanent support floor. This is the exact moment an "asset" becomes a "long-term position."
Notice how the 1.0 Fibonacci level (₹2,534) acted as resistance in 2022, then support in 2023. This role reversal is a key confirmation signal that institutions are committed to the uptrend.
🔍 Multi-Timeframe Analysis (Critical for Backtesting)
Before any trade execution, cross-referencing multiple timeframes is essential to avoid false signals:
All timeframes align - this is a low-probability failure setup.
Expert Learning: Global Market Correlation
Just as we analyze Fed rate cuts (which famously pumped ₹15,300 Cr into Indian equities in June 2025), we must watch how FII flows react to technical breakouts.
DXY Impact: When the Dollar Index (DXY) stays below 103, there is an 88% probability of FII buying, which provides the fuel for these Fibonacci extensions to reach their 1.618 targets. This is why global macro analysis must complement technical study.
📌 Key Takeaways for Students of the Market
- Patience pays a "Time Tax": You must study through the boring ₹100–₹200 range to understand the context for the ₹4,000 extension.
- Identify the Ceiling: Huge wealth is made when a 5-year resistance (like ₹230) is broken with high volume. This is the "point of recognition."
- Trust the Math, Verify with Timeframes: Fibonacci levels provide an exit strategy that emotion cannot. Always check multiple timeframes before drawing conclusions.
- Backtest Before Execution: Study how this stock behaved at key levels in 2017, 2020, and 2023. History doesn't repeat, but it often rhymes.
- Volume Confirms Price: Notice how each breakout above Fibonacci levels was accompanied by above-average volume. Without volume, breakouts often fail.
Important Learning Methodology
This is purely educational content. The purpose is to demonstrate how to:
- Apply Fibonacci tools to real market examples
- Use multiple timeframes for confirmation
- Identify institutional accumulation zones
- Backtest strategies before considering execution
- Understand that no single indicator guarantees success
Remember: The market is a learning laboratory. Study, observe, and always validate with your own research.
❓ Frequently Asked Questions (For Learning)
The Art of Learning Markets
The ADANIENT example is just one case study. The real value comes from applying this framework to other stocks, indices, and even commodities. Each market has its own personality, but the mathematical relationships remain constant.
Suggested Learning Path:
- Study this ADANIENT example thoroughly - understand why each level matters
- Apply the same analysis to other multi-bagger stocks (look for similar patterns)
- Start with monthly charts to see the big picture, then drill down to daily
- Keep a journal of what you observe - your own data is your best teacher
- Never stop learning - markets evolve, but human psychology (and Fibonacci) remains constant
Back to Educational Blog | Published for Learning Purposes Only